3.1 Reorganising data
It is rarely the case that the form in which data are collected is immediately suitable for analysis. There are often things we need to do to put the data into a more suitable structure. Here is an example.
Data on the number of deaths related to covid-19 are available from the National Records of Scotland. Background information is available from the detailed notes by selecting the About tab. The data can be conveniently accessed through the rp.datalink function. The function str gives a useful indication of the type of data present.
## 'data.frame':    10510 obs. of  9 variables:
##  $ FeatureCode    : chr  "S92000003" "S92000003" "S92000003" "S92000003" ...
##  $ DateCode       : chr  "w/c 2020-08-17" "w/c 2020-11-02" "w/c 2020-09-14" "w/c 2020-08-10" ...
##  $ Measurement    : chr  "Count" "Count" "Count" "Count" ...
##  $ Units          : chr  "Deaths" "Deaths" "Deaths" "Deaths" ...
##  $ Value          : num  0 9 0 1 32359 ...
##  $ Sex            : chr  "Female" "Female" "Female" "Female" ...
##  $ Age            : chr  "45-64 years" "45-64 years" "45-64 years" "45-64 years" ...
##  $ CauseOfDeath   : chr  "COVID-19 related" "COVID-19 related" "COVID-19 related" "COVID-19 related" ...
##  $ LocationOfDeath: chr  "All" "All" "All" "All" ...
Like all real datasets, we need to think carefully about the structure of the data, the way it has been coded and many other detailed aspects. As our understanding grows and our thinking develops so too the R script we use will evolve to represent our exploration and analysis. The code below is the product of a lot of experimentation - and many mistakes! For example, it took a while to understand the meaning of the FeatureCode variable. The setting shown below gives the data for the whole of Scotland, but more serious use of the data should confirm and document that.
As ever, some filtering and recoding of the data may be useful. The code below uses the subset function to pull out the data for Scotland as a whole, for cause of death related to covid 19, for deaths in all settings. Summary numbers for the years 2020 and 2021 are also removed. It is also helpful to indicate that the information in DateCode is a date, as R has special facilities for dates. The sub function removes the “w/c” text at the start of each date code and the uses the as.Date function to tell R that this is a date.
covid_deaths <- subset(covid_deaths, FeatureCode == "S92000003" &
                                     CauseOfDeath == "COVID-19 related" &
                                     LocationOfDeath == "All" &
                                     !(DateCode %in% c("2020", "2021")))
covid_deaths$DateCode <- sub("w/c ", "", covid_deaths$DateCode)
covid_deaths$Date     <- as.Date(covid_deaths$DateCode)
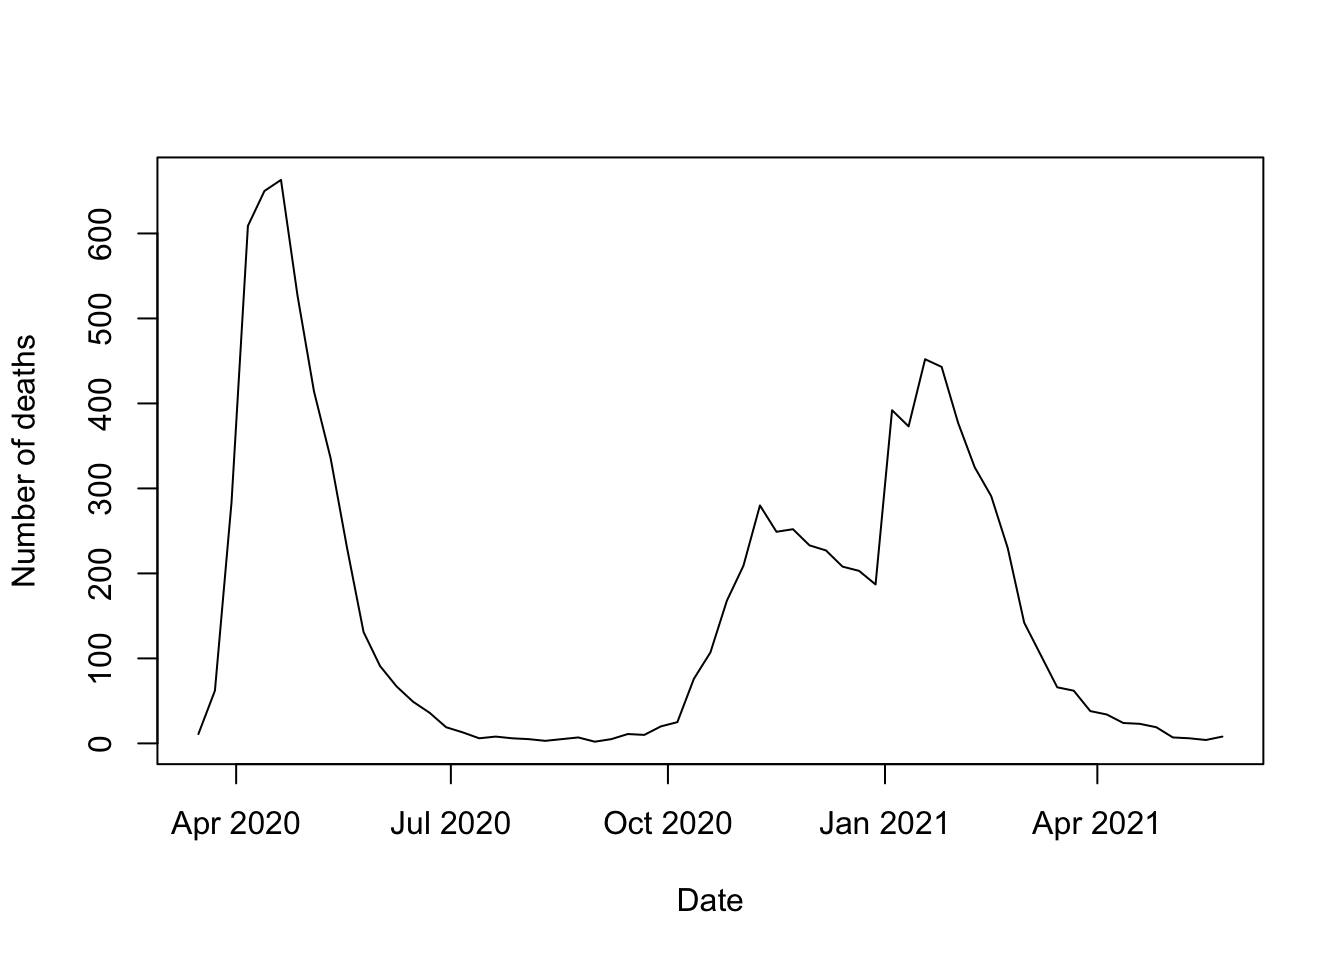
In order to plot the deaths over time, we need to ensure that we have the dates in the correct order. The order function returns the set of indices which will do this. We can then use the square bracket notation to put the dates and numbers of deaths into the correct order. The type = 'l' argument in the plot function joins these points by lines.
sbst <- subset(covid_deaths, Age == "All" & Sex == 'All')
ind <- order(sbst$Date)
plot(sbst$Date[ind], sbst$Value[ind], type = 'l',
     xlab = 'Date', ylab = 'Number of deaths')
This shows the overall course of the pandemic in the UK. An exercise at the end of Chapter 4 on Data Visualisation chapter will invite you to explore this at more detailed levels of age and sex.